Quantamental Close Daily
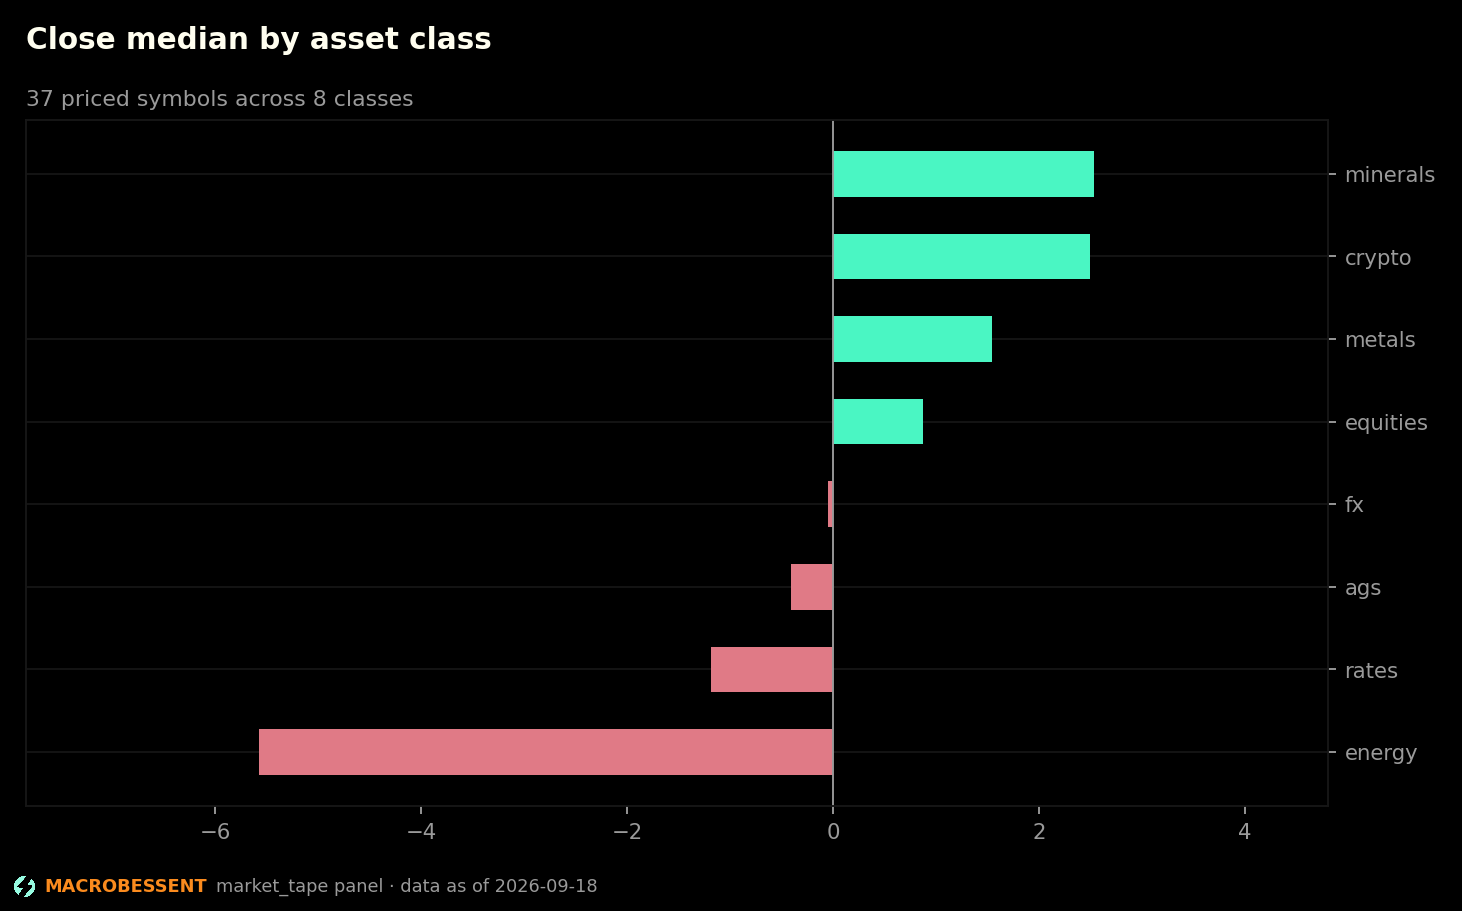
All-asset quantamental signature after the US close: class medians, sector leadership, credit and the Fed book, options scalars and PM depth.
data as of 2026-09-18 · published 2026-09-18 · next update tomorrow, after the US close
TL;DR — the read in bullets
- Quantamental Close Daily. 21 of 37 priced symbols closed higher. Widest gain Sugar +5.63%; widest fall Gasoline -9.16%.
- Convergence: 5 signals across 4 categories; the panel calls this agreement.
3 further findings and the rest of the analysis are in the full report.
They are absent from this page, not hidden. View-source and check.
The full report is on Full Access.
See the plansAlready subscribed? Sign in.
Where this is worked out
This daily is the surface. The analysis behind it is carried in these titles, which are on a paid plan:
- Cross-Asset Factor Weekly — Rolling correlations, the FDR-controlled factor table, and which relationships changed sign or lost significance since last week.
- Crowding Cross-Section Weekly — COT, 13F, Deribit and prediction-market concentration on one page. Disagreement is the finding.
- Scorecard Monthly — Tracker accuracy by signal class, Brier against the base rate, lockbox results, this month's null registry additions, and what we got wrong.
MacroBessent Research is market commentary and data analysis. It is not investment advice, and nothing here is a recommendation to buy or sell anything.
MacroBessent is a research publication and is not investment advice; nothing here is a recommendation to buy or sell anything.
MacroBessent is a research publication and is not investment advice; nothing here is a recommendation to buy or sell anything.