S&P 5007,650.50+0.17%Nasdaq26,522.54+0.39%Dow51,682.64-0.18%Nikkei 22565,018.95+1.38%Hang Seng24,750.78+0.60%EuroStoxx 506,236.20-1.37%Dollar (DXY)100.22+0.00%EUR/USD1.15+0.18%USD/JPY156.85+0.46%GBP/USD1.34+0.26%USD/CNY6.70-0.15%US 10Y yield5.00+1.03%US 5Y yield4.86+1.15%Gold4,424.90+0.57%Silver66.56+1.66%Copper6.62+0.43%Platinum1,803.50+0.68%Palladium1,306.20+1.24%WTI100.30-1.58%Brent103.87-0.91%Henry Hub2.91+0.38%Gasoline3.53+0.58%Heating oil5.06-1.10%Wheat714.25-1.75%Corn527.50-0.57%Soybeans1,303.50-1.23%Coffee294.55+1.38%Sugar17.36-0.34%Cocoa5,327.00-7.71%Cotton77.38-1.31%Lithium ETF70.50-0.56%Uranium ETF41.65-2.41%Rare Earths ETF69.06-0.06%Copper Miners ETF87.28+0.77%Bitcoin81,244.98+0.42%Ethereum2,637.29+0.99%Solana111.48-0.99%S&P 5007,650.50+0.17%Nasdaq26,522.54+0.39%Dow51,682.64-0.18%Nikkei 22565,018.95+1.38%Hang Seng24,750.78+0.60%EuroStoxx 506,236.20-1.37%Dollar (DXY)100.22+0.00%EUR/USD1.15+0.18%USD/JPY156.85+0.46%GBP/USD1.34+0.26%USD/CNY6.70-0.15%US 10Y yield5.00+1.03%US 5Y yield4.86+1.15%Gold4,424.90+0.57%Silver66.56+1.66%Copper6.62+0.43%Platinum1,803.50+0.68%Palladium1,306.20+1.24%WTI100.30-1.58%Brent103.87-0.91%Henry Hub2.91+0.38%Gasoline3.53+0.58%Heating oil5.06-1.10%Wheat714.25-1.75%Corn527.50-0.57%Soybeans1,303.50-1.23%Coffee294.55+1.38%Sugar17.36-0.34%Cocoa5,327.00-7.71%Cotton77.38-1.31%Lithium ETF70.50-0.56%Uranium ETF41.65-2.41%Rare Earths ETF69.06-0.06%Copper Miners ETF87.28+0.77%Bitcoin81,244.98+0.42%Ethereum2,637.29+0.99%Solana111.48-0.99%
Quality and Value Screen Weekly
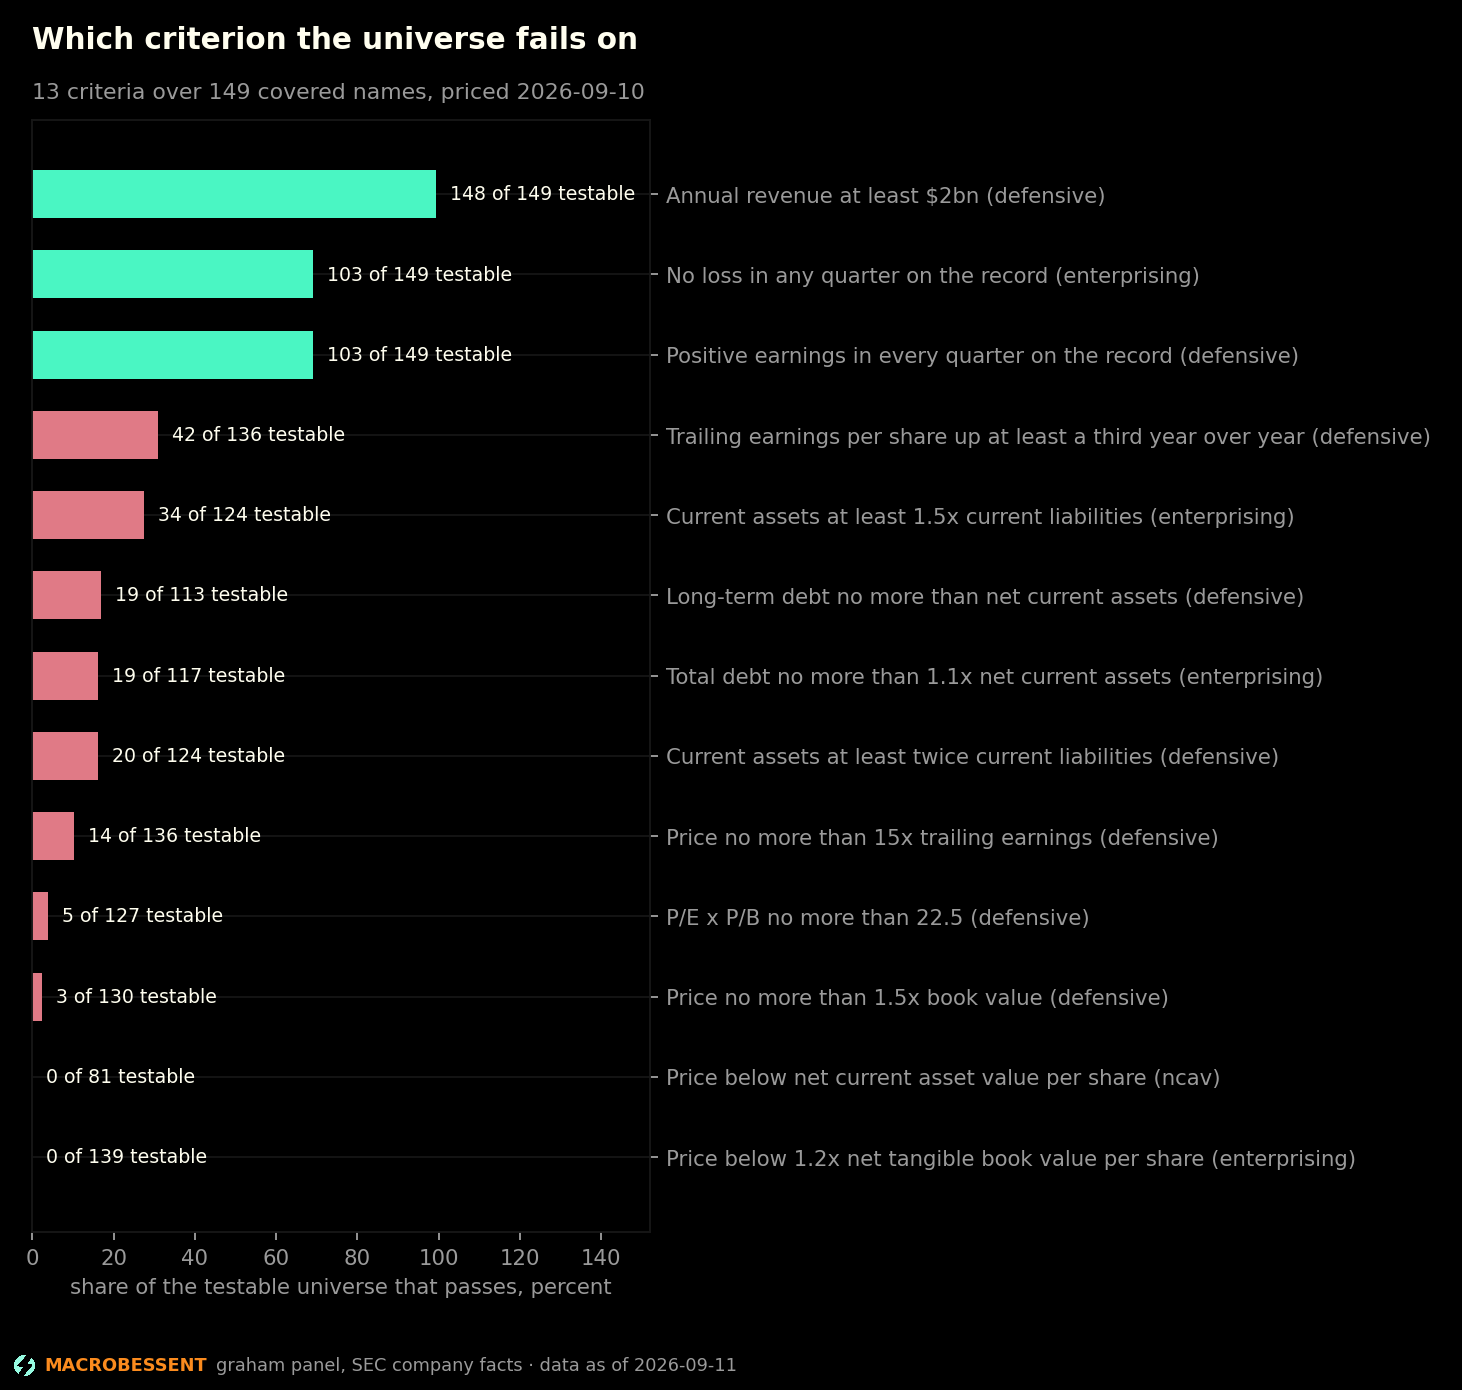
Graham's criteria with the pass rate and testable count on each, the earnings quality cross-section, and returns on capital against what they cost.
data as of 2026-09-11 · published 2026-09-14 · next update next Monday
TL;DR — the read in bullets
- Of 149 covered names the panel's headline counts are 0 clearing every Defensive criterion, 0 every Enterprising criterion and 0 trading below net current asset value. 5 of 127 names with a positive price/earnings and price/book pass the 22.5 multiplier test.
5 further findings, 3 charts and the method notes are in the full report.
They are absent from this page, not hidden. View-source and check.
The full report is on Full Access.
See the plansAlready subscribed? Sign in.
MacroBessent Research is market commentary and data analysis. It is not investment advice, and nothing here is a recommendation to buy or sell anything.