Physical Metals Weekly
What the physical market says that the price chart doesn't: official fixes, the copper cash–3-month spread, and the visible inventory buffer.
data as of 2026-09-18 · published 2026-09-19 · next update weekly
TL;DR — the read in bullets
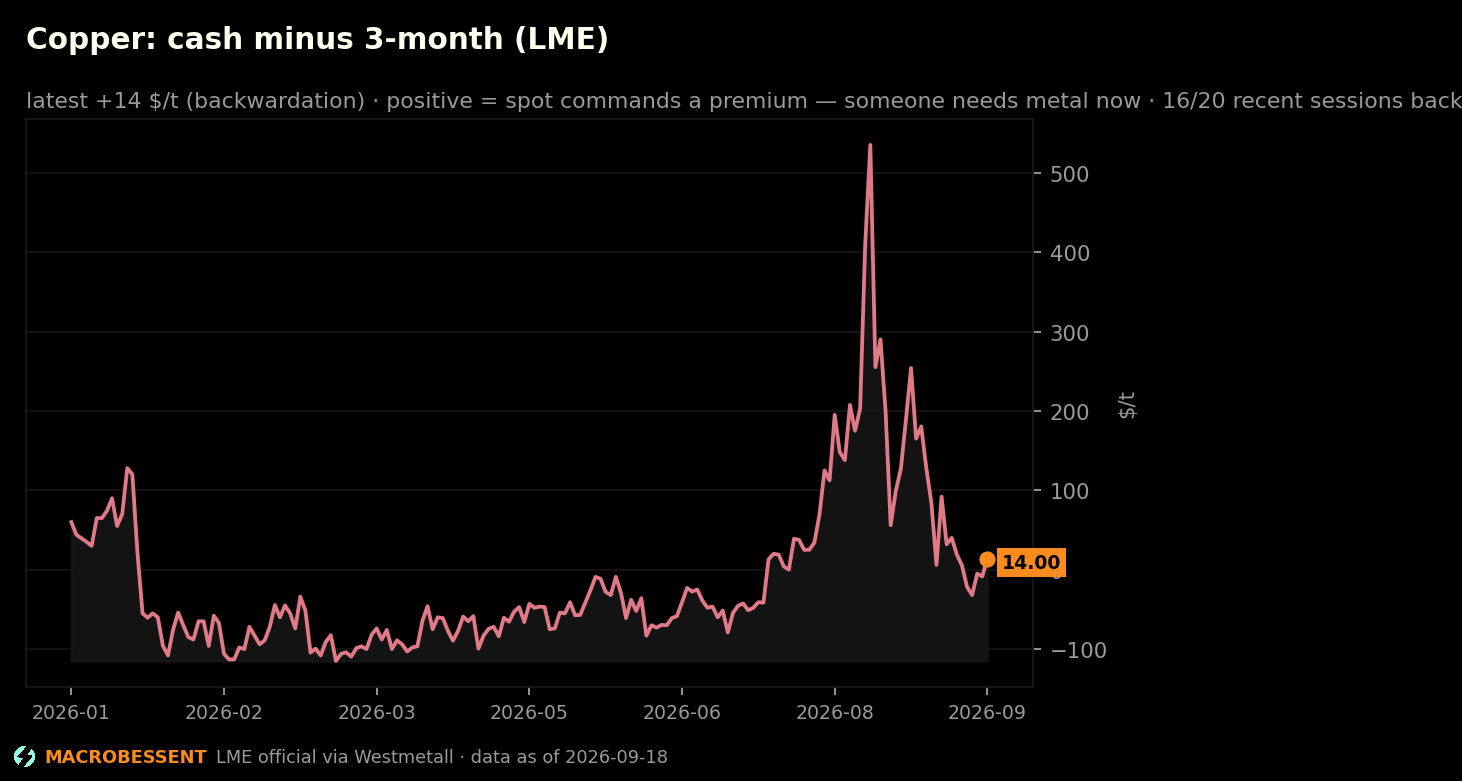
- Copper is in BACKWARDATION: cash trades 14 $/t ABOVE 3-month, backwardated in 16 of the last 20 sessions — while LME warehouse stocks are UP 76% YTD to 255,100 t. Spot premium alongside rising inventories is a tension worth watching: the spread says now-metal is scarce where it's wanted, the stocks say the buffer is growing where it's stored.
2 further findings, 3 charts and the rest of the analysis are in the full report.
They are absent from this page, not hidden. View-source and check.
The full report is on Full Access.
See the plansAlready subscribed? Sign in.
MacroBessent Research is market commentary and data analysis. It is not investment advice, and nothing here is a recommendation to buy or sell anything.
MacroBessent is a research publication and is not investment advice; nothing here is a recommendation to buy or sell anything.
MacroBessent is a research publication and is not investment advice; nothing here is a recommendation to buy or sell anything.