S&P 5007,650.50+0.17%Nasdaq26,522.54+0.39%Dow51,682.64-0.18%Nikkei 22565,018.95+1.38%Hang Seng24,750.78+0.60%EuroStoxx 506,236.20-1.37%Dollar (DXY)100.22+0.00%EUR/USD1.15+0.18%USD/JPY156.85+0.46%GBP/USD1.34+0.26%USD/CNY6.70-0.15%US 10Y yield5.00+1.03%US 5Y yield4.86+1.15%Gold4,424.90+0.57%Silver66.56+1.66%Copper6.62+0.43%Platinum1,803.50+0.68%Palladium1,306.20+1.24%WTI100.30-1.58%Brent103.87-0.91%Henry Hub2.91+0.38%Gasoline3.53+0.58%Heating oil5.06-1.10%Wheat714.25-1.75%Corn527.50-0.57%Soybeans1,303.50-1.23%Coffee294.55+1.38%Sugar17.36-0.34%Cocoa5,327.00-7.71%Cotton77.38-1.31%Lithium ETF70.50-0.56%Uranium ETF41.65-2.41%Rare Earths ETF69.06-0.06%Copper Miners ETF87.28+0.77%Bitcoin81,244.98+0.42%Ethereum2,637.29+0.99%Solana111.48-0.99%S&P 5007,650.50+0.17%Nasdaq26,522.54+0.39%Dow51,682.64-0.18%Nikkei 22565,018.95+1.38%Hang Seng24,750.78+0.60%EuroStoxx 506,236.20-1.37%Dollar (DXY)100.22+0.00%EUR/USD1.15+0.18%USD/JPY156.85+0.46%GBP/USD1.34+0.26%USD/CNY6.70-0.15%US 10Y yield5.00+1.03%US 5Y yield4.86+1.15%Gold4,424.90+0.57%Silver66.56+1.66%Copper6.62+0.43%Platinum1,803.50+0.68%Palladium1,306.20+1.24%WTI100.30-1.58%Brent103.87-0.91%Henry Hub2.91+0.38%Gasoline3.53+0.58%Heating oil5.06-1.10%Wheat714.25-1.75%Corn527.50-0.57%Soybeans1,303.50-1.23%Coffee294.55+1.38%Sugar17.36-0.34%Cocoa5,327.00-7.71%Cotton77.38-1.31%Lithium ETF70.50-0.56%Uranium ETF41.65-2.41%Rare Earths ETF69.06-0.06%Copper Miners ETF87.28+0.77%Bitcoin81,244.98+0.42%Ethereum2,637.29+0.99%Solana111.48-0.99%
Global Macro Divergence Weekly
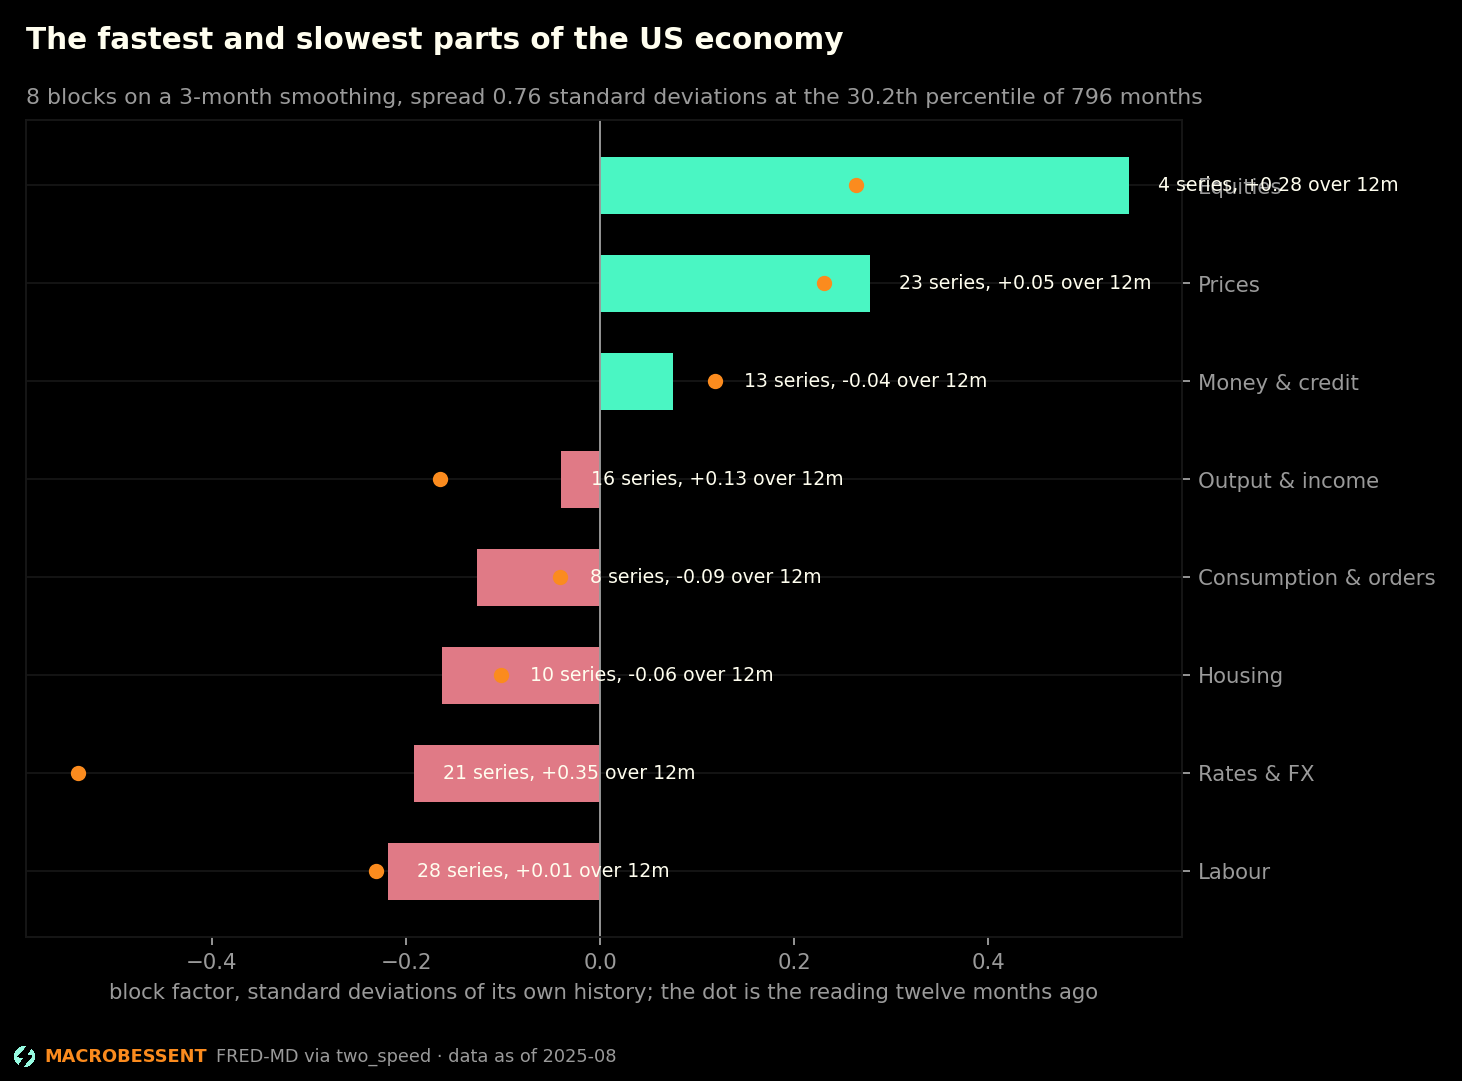
The cross-section by growth-inflation box, the two-speed spread inside the US economy, the activity factor, and what followed the dated crossings the panels carry.
data as of 2026-09-17 · published 2026-09-17 · next update next Thursday
TL;DR — the read in bullets
- Across 210 economies on the IMF projection for 2026, 104 sit in slowdown + inflation, and the four boxes split slowdown + inflation 104; expansion + inflation 43; slowdown + disinflation 40; expansion + disinflation 23.
- Cross-sectional growth dispersion is 2.42, the 2.1th percentile of 45 years of the same measure.
4 further findings, 2 charts and the rest of the analysis are in the full report.
They are absent from this page, not hidden. View-source and check.
The full report is on Full Access.
See the plansAlready subscribed? Sign in.
MacroBessent Research is market commentary and data analysis. It is not investment advice, and nothing here is a recommendation to buy or sell anything.