S&P 5007,650.50+0.17%Nasdaq26,522.54+0.39%Dow51,682.64-0.18%Nikkei 22565,018.95+1.38%Hang Seng24,750.78+0.60%EuroStoxx 506,236.20-1.37%Dollar (DXY)100.22+0.00%EUR/USD1.15+0.18%USD/JPY156.85+0.46%GBP/USD1.34+0.26%USD/CNY6.70-0.15%US 10Y yield5.00+1.03%US 5Y yield4.86+1.15%Gold4,424.90+0.57%Silver66.56+1.66%Copper6.62+0.43%Platinum1,803.50+0.68%Palladium1,306.20+1.24%WTI100.30-1.58%Brent103.87-0.91%Henry Hub2.91+0.38%Gasoline3.53+0.58%Heating oil5.06-1.10%Wheat714.25-1.75%Corn527.50-0.57%Soybeans1,303.50-1.23%Coffee294.55+1.38%Sugar17.36-0.34%Cocoa5,327.00-7.71%Cotton77.38-1.31%Lithium ETF70.50-0.56%Uranium ETF41.65-2.41%Rare Earths ETF69.06-0.06%Copper Miners ETF87.28+0.77%Bitcoin81,244.98+0.42%Ethereum2,637.29+0.99%Solana111.48-0.99%S&P 5007,650.50+0.17%Nasdaq26,522.54+0.39%Dow51,682.64-0.18%Nikkei 22565,018.95+1.38%Hang Seng24,750.78+0.60%EuroStoxx 506,236.20-1.37%Dollar (DXY)100.22+0.00%EUR/USD1.15+0.18%USD/JPY156.85+0.46%GBP/USD1.34+0.26%USD/CNY6.70-0.15%US 10Y yield5.00+1.03%US 5Y yield4.86+1.15%Gold4,424.90+0.57%Silver66.56+1.66%Copper6.62+0.43%Platinum1,803.50+0.68%Palladium1,306.20+1.24%WTI100.30-1.58%Brent103.87-0.91%Henry Hub2.91+0.38%Gasoline3.53+0.58%Heating oil5.06-1.10%Wheat714.25-1.75%Corn527.50-0.57%Soybeans1,303.50-1.23%Coffee294.55+1.38%Sugar17.36-0.34%Cocoa5,327.00-7.71%Cotton77.38-1.31%Lithium ETF70.50-0.56%Uranium ETF41.65-2.41%Rare Earths ETF69.06-0.06%Copper Miners ETF87.28+0.77%Bitcoin81,244.98+0.42%Ethereum2,637.29+0.99%Solana111.48-0.99%
FX Statistical Structure Weekly
The declared rate differential, the dollar-bloc cointegration gate, and carry against realised volatility as a plane rather than a ranking.
data as of 2026-09-11 · published 2026-09-17 · next update next Thursday
TL;DR — the read in bullets
- The declared differential is the ten-year benchmark yield (OECD IRLTLT01 family, monthly). MXN carries the widest at +4.48 points against a US leg of 4.68 percent stamped 2026-08-01, and CHF the tightest at -4.21.
- 2 of 6 dollar-bloc pairs pass Engle-Granger at 0.05 over 252 sessions. The remaining 4 have their residual printed in log points and no z-score attached.
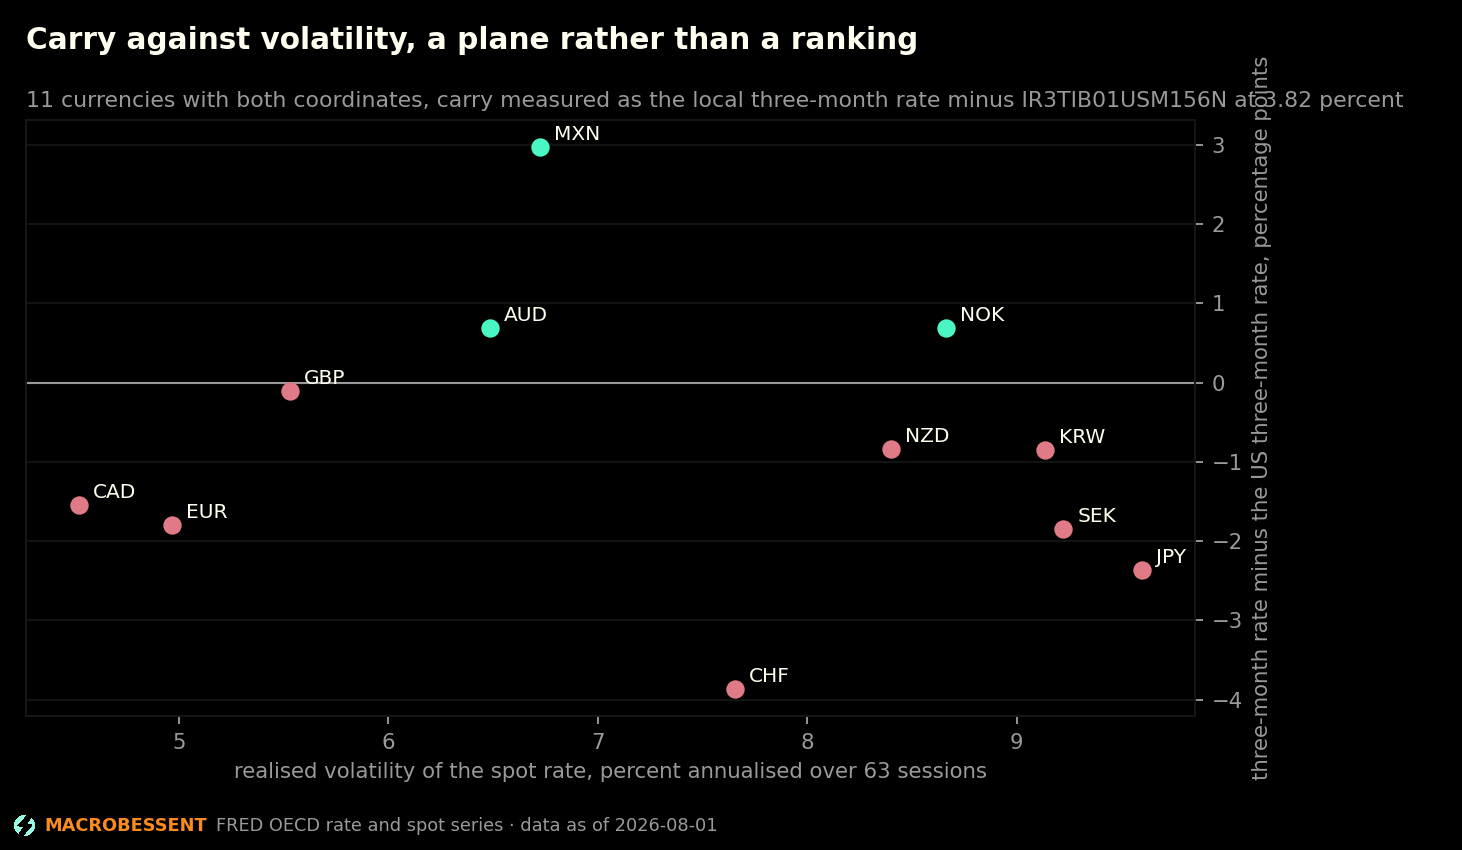
3 further findings, 2 charts and the rest of the analysis are in the full report.
They are absent from this page, not hidden. View-source and check.
The full report is on Full Access.
See the plansAlready subscribed? Sign in.
MacroBessent Research is market commentary and data analysis. It is not investment advice, and nothing here is a recommendation to buy or sell anything.