S&P 5007,650.50+0.17%Nasdaq26,522.54+0.39%Dow51,682.64-0.18%Nikkei 22565,018.95+1.38%Hang Seng24,750.78+0.60%EuroStoxx 506,236.20-1.37%Dollar (DXY)100.22+0.00%EUR/USD1.15+0.18%USD/JPY156.85+0.46%GBP/USD1.34+0.26%USD/CNY6.70-0.15%US 10Y yield5.00+1.03%US 5Y yield4.86+1.15%Gold4,424.90+0.57%Silver66.56+1.66%Copper6.62+0.43%Platinum1,803.50+0.68%Palladium1,306.20+1.24%WTI100.30-1.58%Brent103.87-0.91%Henry Hub2.91+0.38%Gasoline3.53+0.58%Heating oil5.06-1.10%Wheat714.25-1.75%Corn527.50-0.57%Soybeans1,303.50-1.23%Coffee294.55+1.38%Sugar17.36-0.34%Cocoa5,327.00-7.71%Cotton77.38-1.31%Lithium ETF70.50-0.56%Uranium ETF41.65-2.41%Rare Earths ETF69.06-0.06%Copper Miners ETF87.28+0.77%Bitcoin81,244.98+0.42%Ethereum2,637.29+0.99%Solana111.48-0.99%S&P 5007,650.50+0.17%Nasdaq26,522.54+0.39%Dow51,682.64-0.18%Nikkei 22565,018.95+1.38%Hang Seng24,750.78+0.60%EuroStoxx 506,236.20-1.37%Dollar (DXY)100.22+0.00%EUR/USD1.15+0.18%USD/JPY156.85+0.46%GBP/USD1.34+0.26%USD/CNY6.70-0.15%US 10Y yield5.00+1.03%US 5Y yield4.86+1.15%Gold4,424.90+0.57%Silver66.56+1.66%Copper6.62+0.43%Platinum1,803.50+0.68%Palladium1,306.20+1.24%WTI100.30-1.58%Brent103.87-0.91%Henry Hub2.91+0.38%Gasoline3.53+0.58%Heating oil5.06-1.10%Wheat714.25-1.75%Corn527.50-0.57%Soybeans1,303.50-1.23%Coffee294.55+1.38%Sugar17.36-0.34%Cocoa5,327.00-7.71%Cotton77.38-1.31%Lithium ETF70.50-0.56%Uranium ETF41.65-2.41%Rare Earths ETF69.06-0.06%Copper Miners ETF87.28+0.77%Bitcoin81,244.98+0.42%Ethereum2,637.29+0.99%Solana111.48-0.99%
Crop and Weather Weekly
The WASDE revisions on the agency's own arithmetic, world balance sheets with and without China, the ENSO state with its analogues, and heating demand against the climatology.
data as of 2026-09-11 · published 2026-09-18 · next update next Friday
TL;DR — the read in bullets
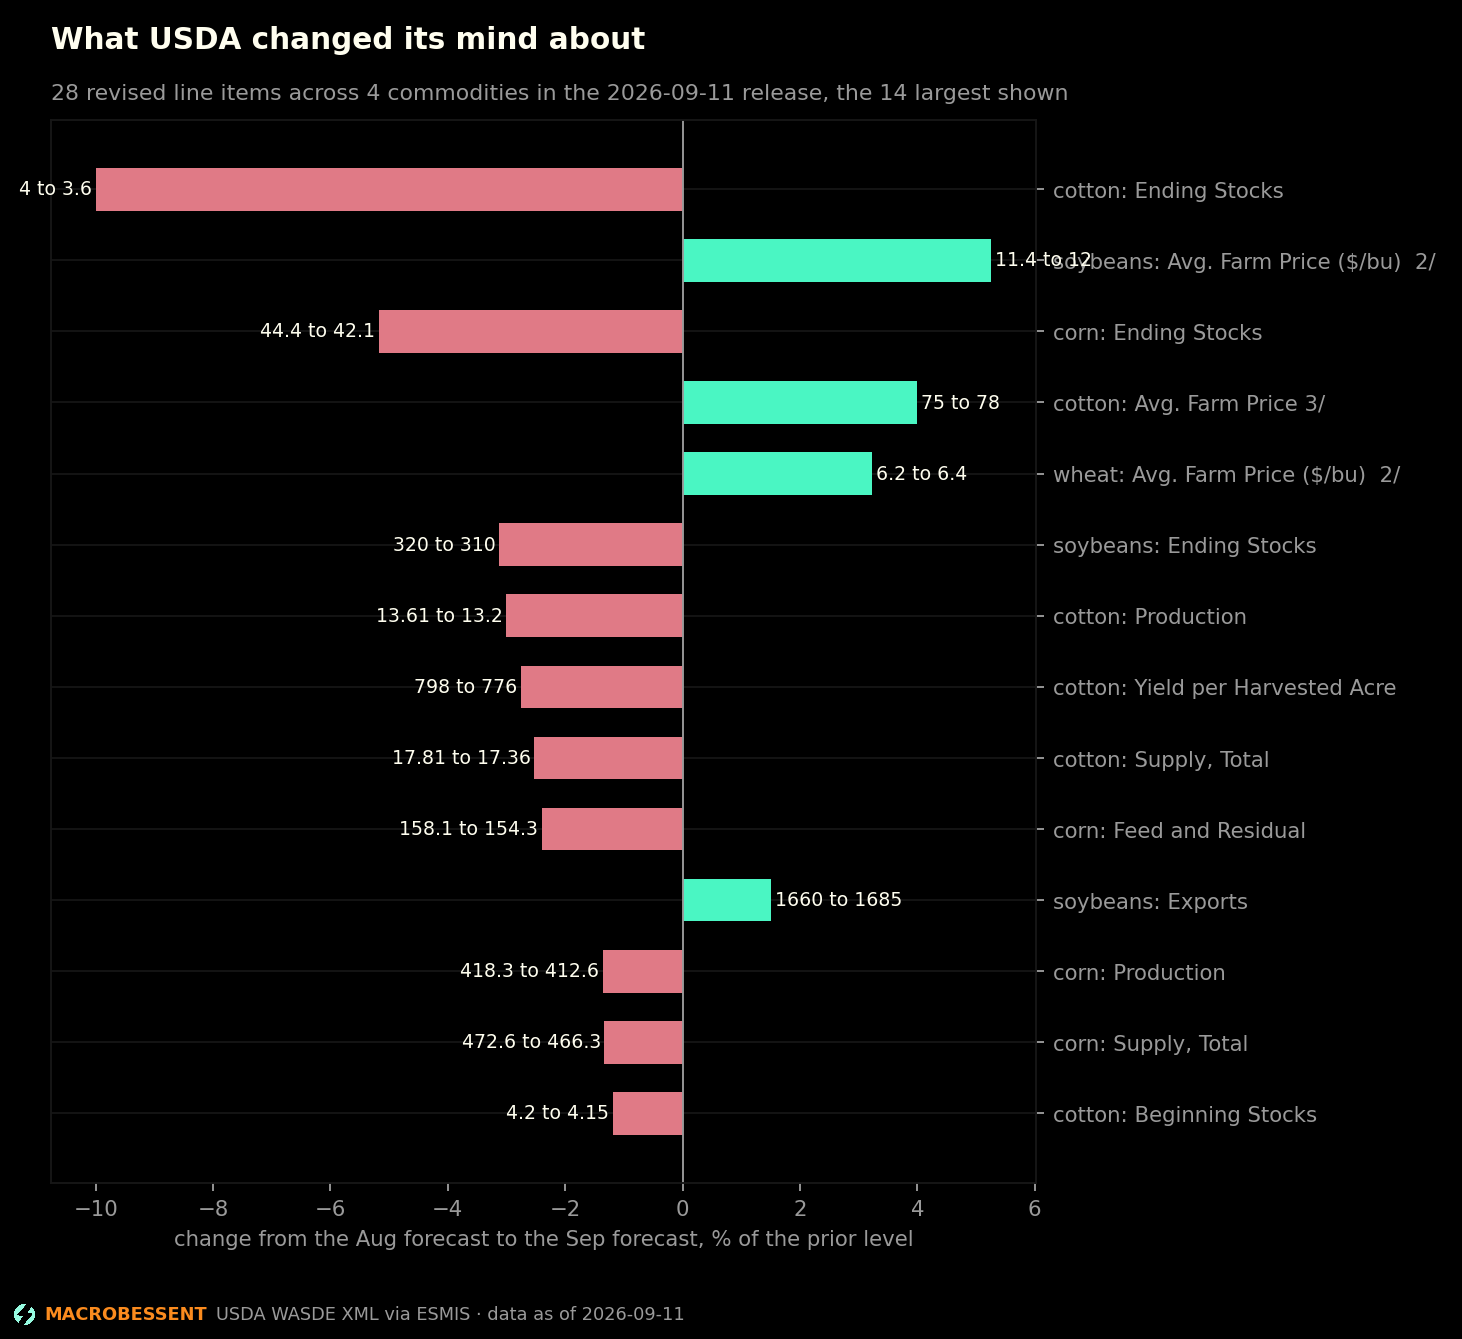
- The 2026-09-11 WASDE revised 28 line items across 4 commodities from the Aug forecast to the Sep forecast. The largest move is cotton Ending Stocks at -10.00%, from 4 to 3.6.
- US stocks-to-use on the new forecast: corn 9.92%; wheat 38.26%; soybeans 6.78%; cotton 26.09%.
4 further findings, 2 charts and the rest of the analysis are in the full report.
They are absent from this page, not hidden. View-source and check.
The full report is on Full Access.
See the plansAlready subscribed? Sign in.
MacroBessent Research is market commentary and data analysis. It is not investment advice, and nothing here is a recommendation to buy or sell anything.