Closing Tape Daily
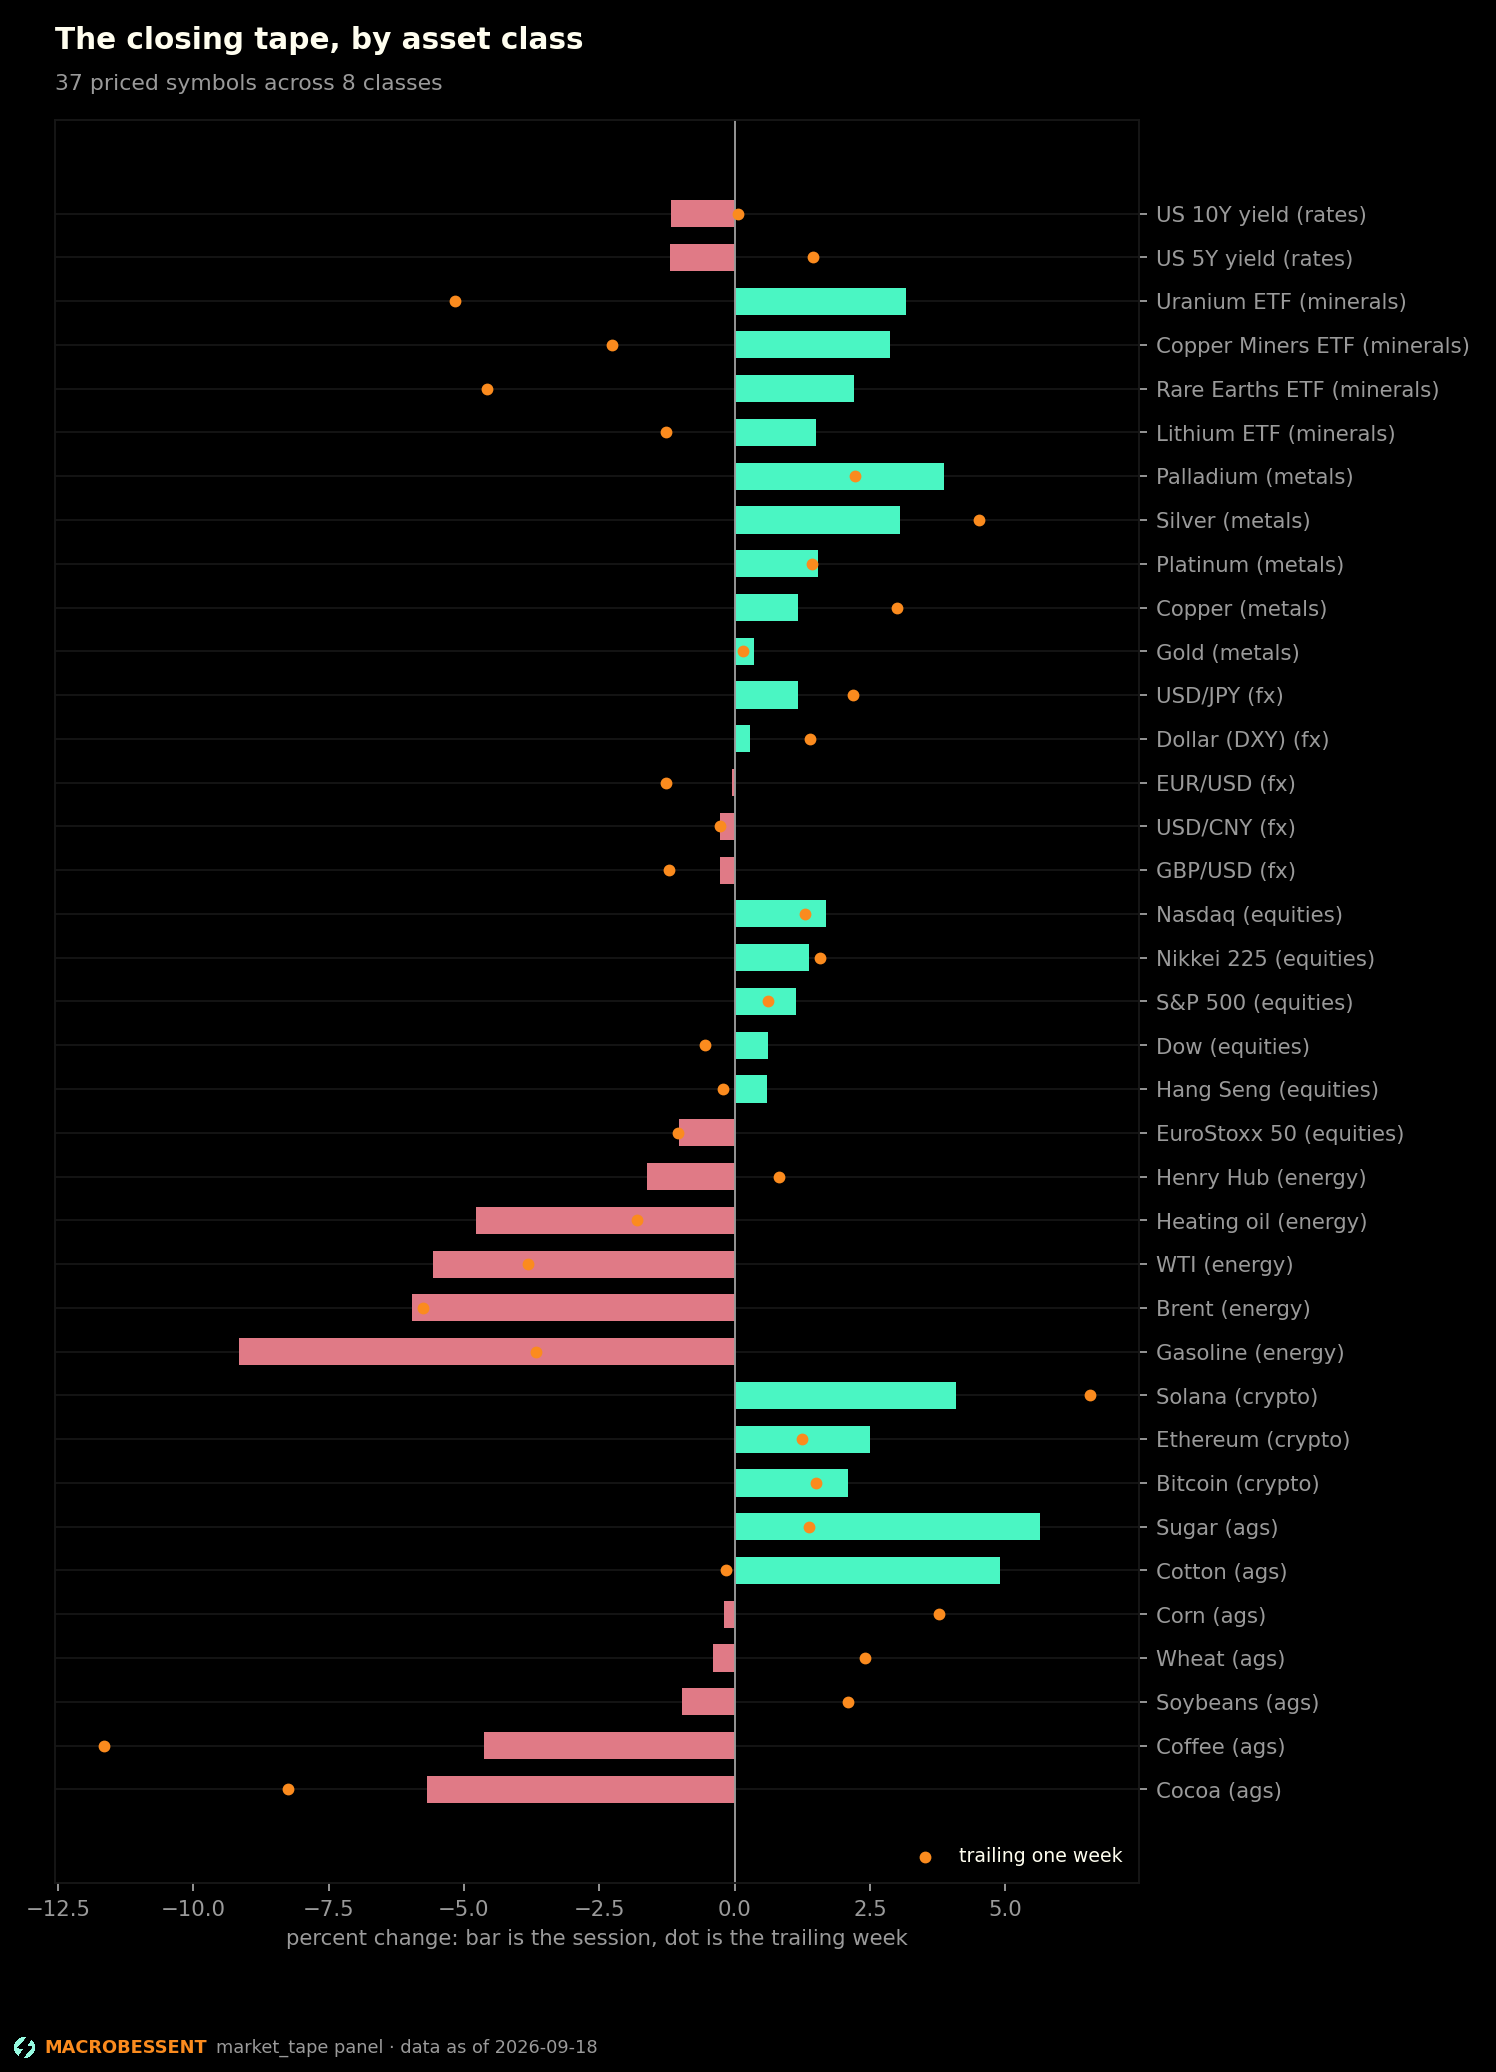
The session across every asset class with the week beside it, sector leadership and breadth against the benchmark fund, liquidity into the close, and where the panels agreed.
data as of 2026-09-18 · published 2026-09-18 · next update after the next US close
TL;DR — the read in bullets
- 21 of 37 priced symbols closed higher. Widest gain Sugar +5.63%; widest fall Gasoline -9.16%. Trailing week beside each.
- 4 of 11 sectors are ahead of SPY over 21 sessions. Communication services leads at 2.32 points relative, Industrials trails at -7.3. Sector data is stamped 2026-09-17.
3 further findings, 1 chart and the rest of the analysis are in the full report.
They are absent from this page, not hidden. View-source and check.
The full report is on Full Access.
See the plansAlready subscribed? Sign in.
Where this is worked out
This daily is the surface. The analysis behind it is carried in these titles, which are on a paid plan:
- Sector Rotation Weekly — Relative strength across the eleven sector funds, cross-sectional dispersion against its own three years, breadth, and the sector medians of return on capital with the count behind each one.
- Cross-Asset Factor Weekly — Rolling correlations, the FDR-controlled factor table, and which relationships changed sign or lost significance since last week.
- Cross-Asset Volatility Monthly — Where volatility is rich and where it's cheap — implied minus realized, standardized, across equities, gold, oil and the euro.
MacroBessent Research is market commentary and data analysis. It is not investment advice, and nothing here is a recommendation to buy or sell anything.
MacroBessent is a research publication and is not investment advice; nothing here is a recommendation to buy or sell anything.
MacroBessent is a research publication and is not investment advice; nothing here is a recommendation to buy or sell anything.